Uncategorized
Decline in oil prices will have significant impact on Oman’s economic and fiscal indicators: S&P
According to Standard & Poor’s ratings services, the decline in oil prices will have a significant impact on Oman’s economic and fiscal indicators given its high dependence on oil. They also forecasted that Oman’s GDP per capita will fall to $14,600 in 2016 from $20,500 in 2014, while the annual average increase in general government debt will be about 5 per cent of GDP in 2016-2019.
Standard & Poor’s Ratings Services lowered its long- and short-term foreign and local currency sovereign credit ratings on the Sultanate of Oman to ‘BBB-/A-3’ from ‘BBB+/A-2’. The outlook is stable. At the same time, they have revised their transfer and convertibility (T&C) assessment on Oman to ‘BBB’ from ‘A-’.
As a “sovereign rating” (as defined in EU CRA Regulation 1060/2009 “EU CRA Regulation”), the ratings on the Sultanate of Oman are subject to certain publication restrictions set out in Art 8a of the EU CRA Regulation, including publication in accordance with a pre-established calendar (see “Calendar Of 2016 EMEA Sovereign, Regional, And Local Government Rating Publication Dates,” published Dec. 22, 2015, on RatingsDirect). Under the EU CRA Regulation, deviations from the announced calendar are allowed only in limited circumstances and must be accompanied by a detailed explanation of the reasons for the deviation. In this case, the reason for the deviation is the recent revision of Standard & Poor’s global oil price assumptions.
The next rating publication on Oman is scheduled for May 20, 2016, according to our calendar. In mid-January 2016, Standard & Poor’s materially lowered its oil price assumptions for the period 2016-2019. Prices for crude oil in spot and futures markets are about 70 per cent below mid-2014 levels, when prices began to slide. When we last reviewed Oman published Nov. 20, 2015, on RatingsDirect), we expected Brent oil prices to average $55 per barrel (/bbl) in 2016 and to gradually recover to $70/bbl in 2018 and beyond. We now assume an average Brent oil price of $40/bbl in 2016 and $50/bbl by2018 published Jan. 12, 2016).
Excerpts:
We do not expect the Feb. 16, 2016, agreement between oil ministers from Qatar, Russia, Saudi Arabia, and Venezuela to freeze output at the levels reported in January will have a material impact on our oil price assumptions. We note that the first market reaction to this news was a further decline in oil prices. On the supply side, we note that the freeze would take place at already record high levels of output for Russia and Saudi Arabia. We also note that the agreement is conditional on other producers freezing production. On the demand side, we see China’s economic slowdown and debt load as a continuing top global risk. Our long-term oil price assumptions will continue to be informed by our view of the marginal cost of oil production.
In November 2015, we said we could lower the ratings on Oman if it appeared we had underestimated the likely negative impact of lower oil prices on the economy. We now project a more material deterioration in Oman’s economic and fiscal outlook. We have therefore lowered our long-term ratings on Oman to ‘BBB-‘.
In Oman, the hydrocarbon sector accounted for just under half of GDP in 2014, slightly over half of exports, and three-quarters of government revenues. However, the hydrocarbon sector’s contribution to the economy fell to about 35 per cent of GDP over the first half of 2015 following the pronounced decline in oil prices.
Given the country’s high dependence on this commodity, we have revised our forecasts for economic growth and the fiscal and external positions to incorporate the lower expected oil prices. Since our review last November, we have reduced our real GDP growth forecasts for Oman over 2016-2019 to an average of 1.4 per cent a year from about 3.0 per cent, while our GDP per capita estimate for 2016 has fallen to $14,600 compared with the $16,300 we had expected at our last review.
We expect only a slow recovery to about $16,000 in 2019 (compared with over $20,000 in 2011-2014). We anticipate that the GDP deflator will remain negative in 2016 (-7 per cent), compared with -20 per cent in 2015. Our forecasts for the change in general government debt (which is our preferred fiscal metric because in most cases it is more comprehensive than the reported headline deficit) have also increased to about 5% of GDP compared with about 3 per cent in November. Furthermore, we now anticipate larger current account deficits, equivalent to 20 per cent of GDP in 2016, compared with 12% of GDP at our November review.

Sohar International Contributes OMR100,000 to Support Those Affected by Al Masarrat Weather Conditions

Liva Insurance Announces New CSR Initiative to Renovate Children’s Cancer Ward at Sultan Qaboos University Hospital

Real Estate Price Index in Oman Grows By 13.9%

Oil Surges More Than 2% as Supply Disruptions Mount

Ibri Industrial City Localises Two Projects Worth RO2M in 2025

VIDEO: Al Khamayil Oman Scales Up Production with New Rusail Facility

Cadillac Enhances Ramadan Ownership Value With Premium Benefits Package

CONNECT and OCEC Partnership Strengthens Oman’s Position as a Global Events Destination

Exclusive: Inside Oman’s Evolving MSME Finance Ecosystem – An Interview with Hussain Al Lawati, CEO, Development Bank

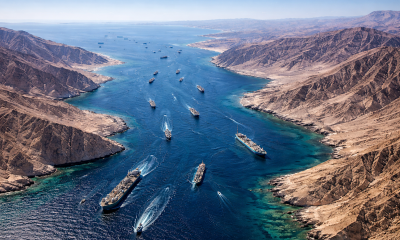
Middle East Tensions Heighten Risks to Strait of Hormuz, Raising Uncertainty for Global Oil Markets

Power And Beyond: The Path To A Low-carbon Future

Al Mouj Muscat unveils Ghadeer Villas

Time to Buy Saudi Stocks? Some Investors Look at Dubai Instead

Renewables are booming, but not fast enough to cap greenhouse emissions

Hospitality Industry in Oman Estimated 90% Growth in 2022

Retail Abu Dhabi’s ‘Unbox Amazing’ generates sales of more than AED 2 billion in participating stores

Saudis Sign Deals From Energy to Metals in Bid to Salvage Forum

Saudi Arabia’s Gold Miner Plans to Be a Global Top-20 Supplier

Technology to drive Sultanate’s downstream industry

Digitization and Logistics Service Providers Can Help SMEs Make the Most of Peak Season Retail Trends

VIDEO: Robert MacLean on how NHI is Shaping Oman’s Next Generation of Hospitality Leaders

The Future of Oman: Decoding The Sultanate of Oman’s Strategic Promotional Nation Brand

EXCLUSIVE: AI, Robotics & Wearable Sensors are Changing the Lives of Dementia Patients

EXCLUSIVE: Talking Renewable Projects & Sustainability in Oman and Beyond with Vipul Tuli

VIDEO: Eng. Salim Al Thuhli, CEO, Khazaen Economic City on Investment Opportunities

H.E. Salim Al Aufi, Minister of Energy & Minerals talks about Oman’s Green Hydrogen Goals

VIDEO: Talking Latest Developments in Aircraft Ground Guidance & More at Oman Airports

VIDEO: Dr. Firas Al-Abduwani Discusses Green Hydrogen, Potential Regions for Development & Creating a Green Ecosystem

VIDEO: Discussing The Future of Green Hydrogen in Oman with H.E. Salim Al Aufi

Celebrating Infoline’s Remarkable 20-Year Journey
-

 Dossier1 month ago
Dossier, 2026
-

 OER Magazines1 month ago
OER, February 26
-
 Banking & Finance1 month ago
Sohar International and Sohar Islamic Supports Over 100 Families in Al Wusta Governorate Through Its ‘Sohar Al Attaa’ Initiative
-

 Banking & Finance1 month ago
National Finance Unveils Exclusive Ramadan Offers on Auto Financing
-

 Economy1 month ago
Analysis: Oman-India CEPA Opens Path to Deeper Trade Investment and Growth
-
 Economy1 month ago
Middle East Tensions Heighten Risks to Strait of Hormuz, Raising Uncertainty for Global Oil Markets
-

 Economy1 month ago
ANALYSIS: Oil Near Seven-Month Highs Amid US, Iran Tensions
-

 Education2 months ago
Jebel View International School to Launch in Muscat in September 2026 & Now Open to Visit
You must be logged in to post a comment Login