Economy
Building Materials Industry Directory in GCC: $37 bln worth of cumulative investments until 2014
The Gulf Organization for Industrial Consulting (GOIC) announced that the GCC building materials industry was ranked third in terms of cumulative investments in 2014.

The Gulf Organization for Industrial Consulting (GOIC) announced that the GCC building materials industry was ranked third in terms of cumulative investments in 2014. This sector was the target of more than 37 billion USD, about 9.8% of the total cumulative investments in manufacturing industries valued at approximately 380 billion USD. There were 2858 factories (about 17.5% of the total number of manufacturing factories amounting to approximately 16292 in 2014). About 259.4 thousand workers were employed in this sector (17% of the total 1.529 million workers).
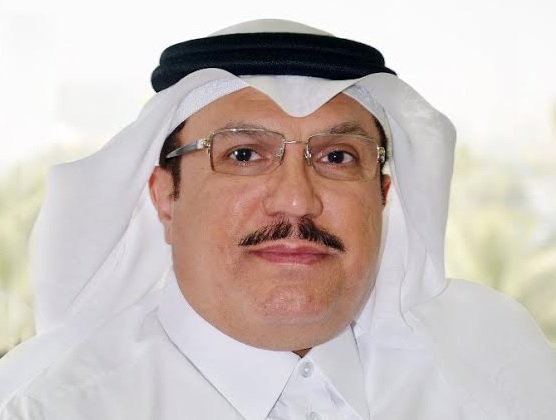
GOIC’s new publication “Building Materials Industry Director in the GCC Countries” (and Yemen) highlighted these figures. The Directory that was published recently is available at GOIC’s Gulf Industrial Knowledge Centre http://www.knowledge.goic.org.qa. In this regard, GOIC Secretary General Mr. Abdulaziz Bin Hamad Al-Ageel stated: “Building materials industry is a key sector in GCC countries, for it is a pillar of development and progress.” He added: “The boom in the Gulf was paralleled with the construction of several residential, industrial, commercial and leisure cities, in addition to infrastructure and public facility projects according to the different needs and development plans of GCC countries.”
Al-Ageel explained: “This Directory is part of a series of specialised industrial directories issued by GOIC to provide information regarding the industrial sector, making the data accessible to the largest number of decision and policy makers, investors and researchers in this field.”
The building materials industry includes several industrial activities according to ISIC as follows: manufacture of glass and glass products, manufacture of refractory products, manufacture of clay building materials, manufacture of other porcelain and ceramic products, manufacture of cement, lime and plaster, manufacture of articles of concrete, cement and plaster, cutting, shaping and finishing of stone and manufacture of other non-metallic mineral products n.e.c.
Since its foundation, GOIC endeavours to spread knowledge and provide information relating to the industrial sector to the largest number of decision and policy makers, investors and researchers in a variety of ways. In this regard, a team of GOIC’s elite experts worked on completing a large set of specialised periodical publications on various industrial sectors in GCC countries and Yemen, in addition to multi-client studies, periodicals, Gulf statistical profiles, and a variety of analytical and statistical books about key industrial sectors. In the future, GOIC will continue to issue similar publications to become reference materials for economy professionals in general, and industrialists in particular.
The development of building materials industry in GCC countries
| Entry | 2010 | 2011 | 2012 | 2013 | 2014 |
| Number of Factories | 2,129 | 2,258 | 2,567 | 2,741 | 2,858 |
| Size of Cumulative Investments – Million USD | 22,359 | 30,886 | 32,695 | 34,448 | 37,272 |
| Labour Force | 185,774 | 204,711 | 222,924 | 234,046 | 259,407 |
The distribution of factories in the building materials sector in GCC countries according to industrial activities
| Factories | 2010 | 2011 | 2012 | 2013 | 2014 | Average growth 5 years |
Percentage 2014 % |
| Manufacture of glass and glass products | 140 | 151 | 164 | 167 | 196 | 8.78 % | %6.9 |
| Manufacture of ceramic products | 55 | 60 | 61 | 65 | 70 | %6.2 | %2.4 |
| Manufacture of cement, lime and plaster | 54 | 59 | 62 | 62 | 67 | %5.5 | %2.3 |
| Manufacture of concrete blocks, bricks and mosaic tiles | 888 | 953 | 1,077 | 1,141 | 1,151 | %6.7 | 40.3 % |
| Manufacture of ready-mix concrete | 415 | 444 | 531 | 586 | 625 | 10.8 % | %21.9 |
| Manufacture of plaster products | 72 | 73 | 81 | 92 | 97 | %7.7 | %3.4 |
| Manufacture of marble and granite | 263 | 289 | 341 | 369 | 398 | 10.9 % | %13.9 |
| Manufacture of sand and gravel | 225 | 204 | 216 | 222 | 218 | 0.8 %- | %7.6 |
| Manufacture of other non-metallic mineral products | 17 | 25 | 34 | 37 | 36 | 20.6 % | %1.3 |
| Manufacture of building materials | 2,129 | 2,258 | 2,567 | 2,741 | 2,858 | %7.6 | 100.0 % |
The development of investments in GCC building materials industry according to industrial activities
| Investments – million USD | 2010 | 2011 | 2012 | 2013 | 2014 | Average growth 5 years | Percentage 2014 % |
| Manufacture of glass and glass products | 1,674 | 2,204 | 2,286 | 2,304 | 2,404 | %9.5 | %6.4 |
| Manufacture of ceramic products | 1,473 | 4,086 | 4,087 | 4,141 | 4,150 | 29.6 % | 11.1 % |
| Manufacture of cement, lime and plaster | 11,882 | 15,435 | 15,769 | 16,034 | 17,526 | 10.2 % | %47.0 |
| Manufacture of concrete blocks, bricks and mosaic tiles | 2,531 | 3,452 | 4,058 | 4,479 | 4,707 | %16.8 | %12.6 |
| Manufacture of ready-mix concrete | 2,651 | 3,253 | 3,776 | 4,687 | 5,266 | %18.7 | %14.1 |
| Manufacture of plaster products | 570 | 716 | 777 | 795 | 1,001 | %15.1 | %2.7 |
| Manufacture of marble and granite | 824 | 941 | 1,054 | 1,077 | 1,206 | %10.0 | %3.2 |
| Manufacture of sand and gravel | 599 | 583 | 614 | 626 | 644 | %1.8 | %1.7 |
| Manufacture of other non-metallic mineral products | 155 | 217 | 275 | 305 | 368 | %24.1 | %1.0 |
| Manufacture of building materials | 22,359 | 30,886 | 32,695 | 34,448 | 37,272 | %13.6 | %100.0 |
GCC building materials industry labour force distribution according to industrial activities
| Labour distribution | 2010 | 2011 | 2012 | 2013 | 2014 | Average growth 5 years | Percentage 2014 % |
| Manufacture of glass and glass products | 13,449 | 15,406 | 16,288 | 16,335 | 18,627 | %8.5 | %7.2 |
| Manufacture of ceramic products | 17,125 | 17,735 | 17,758 | 17,970 | 18,629 | %2.1 | %7.2 |
| Manufacture of cement, lime and plaster | 21,282 | 25,304 | 24,619 | 24,079 | 25,681 | %4.8 | %9.9 |
| Manufacture of concrete blocks, bricks and mosaic tiles | 43,345 | 49,306 | 54,588 | 56,924 | 63,287 | %9.9 | %24.4 |
| Manufacture of ready-mix concrete | 51,323 | 54,587 | 63,501 | 70,982 | 78,771 | %11.3 | %30.4 |
| Manufacture of plaster products | 4,281 | 4,402 | 4,984 | 5,426 | 6,420 | %10.7 | %2.5 |
| Manufacture of marble and granite | 22,000 | 23,232 | 25,153 | 26,064 | 30,174 | %8.2 | %11.6 |
| Manufacture of sand and gravel | 10,411 | 10,751 | 11,746 | 11,902 | 12,840 | %5.4 | %4.9 |
| Manufacture of other non-metallic mineral products | 2,558 | 3,988 | 4,287 | 4,364 | 4,978 | %18.1 | %1.9 |
| Manufacture of building materials | 185,774 | 204,711 | 222,924 | 234,046 | 259,407 | %8.7 | 100.0 % |
-

 Banking & Finance1 month ago
Oman Oil Marketing Company Concludes Its Annual Health, Safety, Environment, and Quality Week, Reaffirming People and Safety as a Top Priority
-

 News1 month ago
Jamal Ahmed Al Harthy Honoured as ‘Pioneer in Youth Empowerment through Education and Sport’ at CSR Summit & Awards 2025
-

 Economy2 months ago
Prime Minister of India Narendra Modi to Visit the Sultanate of Oman on 17-18 December
-

 Economy2 months ago
Oman’s Net Wealth Reaches $300 Billion in 2024, Poised for Steady Growth
-

 News2 months ago
IHE Launches Eicher Pro League of Trucks & Buses in Oman
-

 News2 months ago
Liva Insurance Honored with ‘Insurer of the Year’ Award for 2025
-

 OER Magazines1 month ago
OER, December 2025
-

 News1 month ago
AI Security Conference 2025 Hosted by Securado Highlights the Changing Cybersecurity Landscape


You must be logged in to post a comment Login