
Artificial Intelligence
What the World’s Top 10 Tech CEOs Really Earn
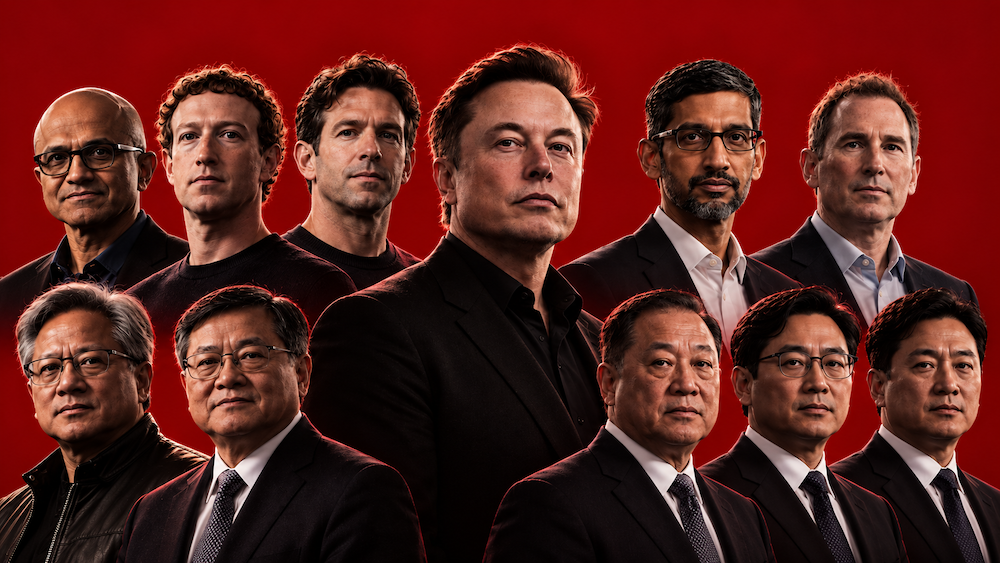
The scale of executive remuneration across the technology industry is extraordinary, yet the figures reveal vastly different approaches to rewarding the people running the world’s most valuable businesses. Some CEOs receive salaries of several million dollars, others are paid a symbolic US$1, and a significant proportion of reported remuneration may consist of shares that cannot immediately be sold – or may never vest at all.
A comparison of the ten companies shows why the headline compensation figure alone tells only part of the story. It also reveals how differently their shares have performed across two distinct periods: the full calendar year of 2025 and the first eight-and-a-half months of 2026.
For this analysis, OERLive selected ten of the world’s most valuable technology-led companies by market capitalisation in September 2026, including semiconductor, software, internet, consumer-electronics and technology-driven automotive businesses.
The comparison uses the latest available annual executive-compensation disclosures and examines share-price performance for calendar 2025 and 2026 year-to-date, using September 18, 2026, as the latest completed trading session.
One important distinction must be established at the outset: total compensation reported in annual filings can include the grant-date value of share awards. It does not necessarily represent cash received by the CEO or the current value of their shareholdings.
The Numbers: CEO Salaries, Total Compensation & Stock Returns
Note: Companies appear in approximate market-capitalisation order. Compensation is from the latest available annual disclosure, except where explicitly identified as a newly announced pay arrangement. Stock returns are rounded to one decimal place.
|
Company & CEO |
Annual base salary |
Total reported compensation |
Stock return: 2025 |
Stock return: 2026 YTD |
|---|---|---|---|---|
|
Nvidia | Jensen Huang |
US$1.50mn |
US$36.34mn (FY2026) |
+38.9% |
+19.2% |
|
Apple | John Ternus |
US$3.00mn |
Not yet reported for his CEO tenure |
+8.6% |
+23.6% |
|
Alphabet | Sundar Pichai |
US$2.00mn |
US$10.91mn (FY2025) |
+64.8% |
+9.8% |
|
Microsoft | Satya Nadella |
US$2.50mn |
US$96.50mn (FY2025) |
+14.7% |
+2.1% |
|
Amazon | Andy Jassy |
US$365,000 |
US$2.07mn (FY2025) |
+5.2% |
+9.9% |
|
TSMC | C.C. Wei |
NT$17.28mn |
NT$2.423bn, approximately US$77.2mn (FY2025) |
+53.9% |
+43.0% |
|
Broadcom | Hock Tan |
US$1.20mn |
US$205.28mn (FY2025) |
+49.3% |
+3.3% |
|
Meta | Mark Zuckerberg |
US$1 |
US$25.13mn (FY2025) |
+12.7% |
+0.9% |
|
Tesla | Elon Musk |
US$0 |
US$158.36bn* (FY2025) |
+11.4% |
−19.0% |
|
Samsung Electronics | co-CEOs Jun Young-hyun/Tae-moon Roh |
₩1.711bn / ₩1.597bn |
₩5.606bn / ₩6.125bn, respectively (FY2025) |
+125.4% |
+117.7% |
Tesla’s reported compensation is an accounting valuation of equity awards, not money paid to Musk. The distinction is examined below.
Apple requires a separate explanation because its leadership changed during the reporting period. John Ternus became CEO on September 1, 2026. His annual salary is US$3 million, and Apple has approved a US$55 million target equity award for fiscal 2027.
That would imply US$58 million in salary and targeted equity before other potential payments, but it is not a reported annual compensation total and should not be presented as money he has earned. Apple also approved a prorated US$2.5 million equity award for his CEO service in fiscal 2026.
For reference, his predecessor Tim Cook received US$74.29 million in reported compensation for fiscal 2025, including a US$3 million salary. Assigning that figure to Ternus would be incorrect.
The US$158 Billion Figure That Needs an Explanation
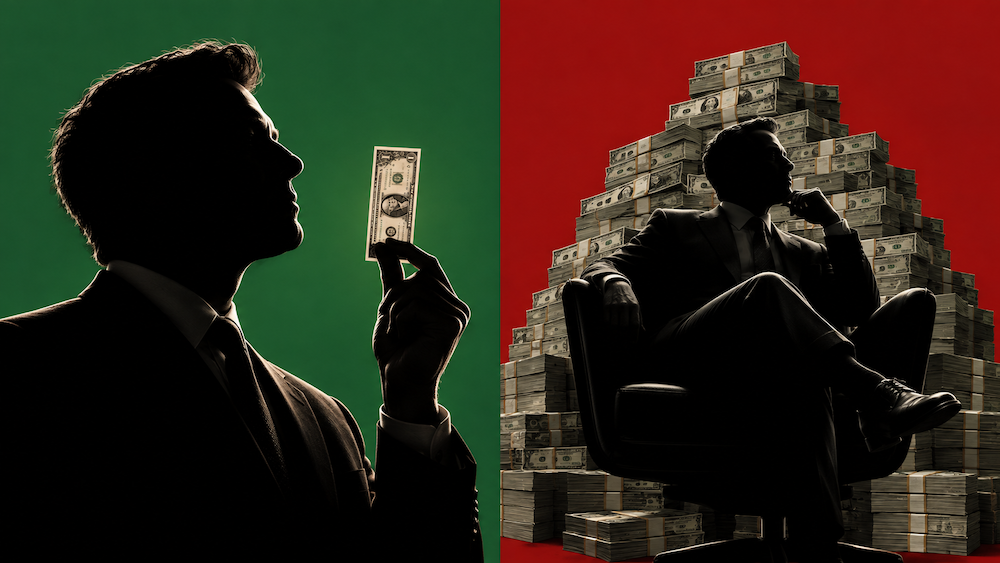
Tesla’s disclosure is the clearest illustration of why total compensation and realised income cannot be treated as interchangeable.
The company reported US$158.36 billion in 2025 compensation for Elon Musk, comprising approximately US$132.30 billion in grant-date fair value attributed to a performance award and US$26.06 billion attributed to an interim award.
The latter was forfeited in April 2026. Tesla stated that no shares under the performance award had vested by the time of its May filing and that Musk’s realised compensation for 2025 was zero, under the company’s disclosed methodology.
The remaining award is subject to demanding conditions and an offset mechanism. Consequently, describing Musk as having been paid US$158 billion in 2025 would be misleading too. It is the amount reported under compensation-accounting rules, not a cash payment or an amount he had realised.
Tesla’s share-price performance offers a separate data point. The stock gained 11.4 per cent in 2025 but had fallen 19.0 per cent from its 2025 closing price by September 18, 2026. Neither movement establishes what Musk ultimately will receive under his long-term award.
Why Broadcom’s CEO Reported More Than US$200 Million
Broadcom’s Hock Tan received US$205.28 million in reported fiscal 2025 compensation but his salary accounted for just US$1.2 million of the total, while stock awards contributed approximately US$202.35 million.
The unusually large figure reflects a front-loaded equity award covering fiscal 2028, 2029 and 2030. Broadcom’s filing says the award is subject to AI-revenue performance and continued-service conditions, and that the company does not intend to make additional annual equity grants to Tan through fiscal 2030.
It would therefore distort the comparison to interpret the entire US$205 million as an ordinary, recurring annual pay package.
Broadcom’s shares advanced 49.3 per cent during 2025 but were up a more modest 3.3 per cent in 2026 through September 18.
The performance conditions attached to Tan’s longer-term award extend well beyond either period.
A US$1 Salary Can Still Produce a US$25 Million Compensation Figure
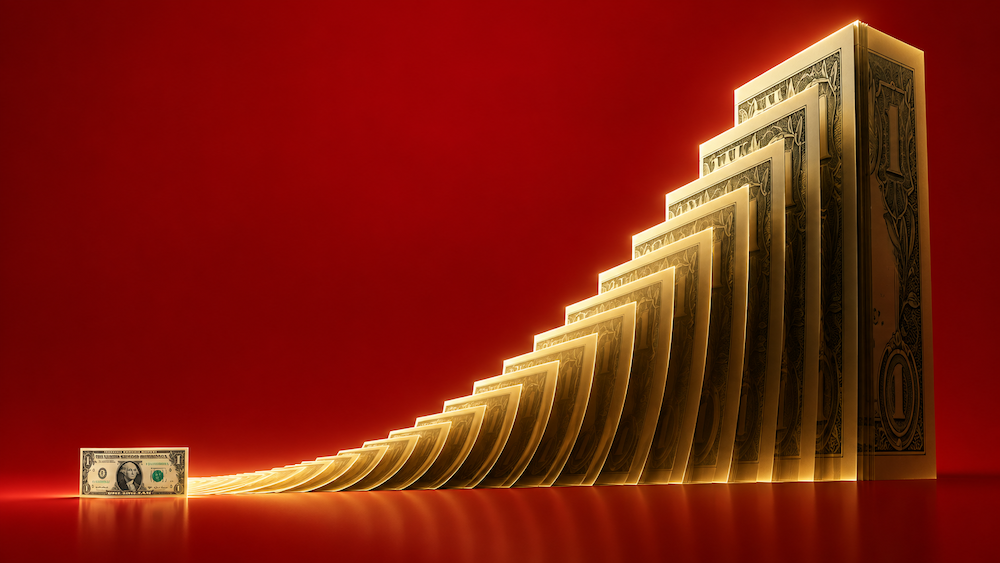
Meta CEO Mark Zuckerberg illustrates a different model. His annual salary remained US$1, and he received no bonus or new equity awards in 2025. Nevertheless, Meta reported total compensation of US$25.13 million.
The difference was principally attributable to company-reported costs and allowances relating to security and private-aircraft use.
Meta includes those amounts in its executive compensation disclosure, even though they should not be confused with an equivalent cash salary.
Amazon’s Andy Jassy provides another useful example. His reported 2025 compensation was US$2.07 million, comprising a US$365,000 salary and approximately US$1.70 million in other compensation.
Amazon reported no new stock award for him that year; however, a single year’s compensation disclosure does not capture the changing value of equity granted in previous years.
The Stock-Market Comparison: 2025 Versus 2026
All ten companies in the selection recorded positive share-price returns in calendar 2025. Samsung Electronics’ Korean-listed common shares rose approximately 125.4 per cent, followed by Alphabet’s Class C shares at 64.8 per cent and TSMC’s US-listed shares at 53.9 per cent.
The results reflect substantial differences in the businesses, share listings and currencies being measured. The picture had changed by September 18, 2026.
Samsung’s shares had risen a further 117.7 per cent in Korean-won terms, while TSMC’s American depositary receipts were up 43.0 per cent.
Apple had gained 23.6 per cent and Nvidia 19.2 per cent. Tesla was the only company in this particular group showing a negative 2026 year-to-date price return.
The contrast between Microsoft and Alphabet is also instructive: Microsoft reported US$96.50 million in fiscal 2025 compensation for Satya Nadella, compared with US$10.91 million for Alphabet’s Sundar Pichai. Yet Alphabet’s selected share class gained 64.8 per cent in 2025 against Microsoft’s 14.7 per cent.
This is not evidence that one CEO was better rewarded for performance: the awards have different structures, grant dates, vesting periods and performance conditions.
The comparison highlights a fundamental difficulty in evaluating executive remuneration using headline numbers. Compensation reported in a particular year may reflect equity awards designed to reward performance several years into the future. Conversely, strong share-price performance in one year does not necessarily translate into additional reported compensation for that same period.
What the Figures Really Tell Investors
For shareholders assessing executive remuneration, the essential question is not simply how large a CEO’s reported pay package appears.
It is how much is fixed, how much depends on measurable outcomes, when equity becomes available to the executive and whether the incentives correspond to sustainable value creation over several years.
The comparison demonstrates three distinct compensation models: substantial annual stock awards, unusually large grants covering multiple future years, and relatively small or symbolic salaries accompanied by other disclosed benefits.
The resulting totals are not directly interchangeable.
Stock performance is similarly only one measure of corporate outcomes. Share prices respond to earnings, investor expectations, valuation changes, interest rates and industry conditions. A rising share price does not establish that a particular compensation structure caused the gain.
There is also an important distinction between remuneration and personal wealth. A CEO may hold billions of dollars in previously acquired shares while receiving a relatively modest salary. Equally, a large stock award reported in a regulatory filing may be subject to years of vesting requirements or demanding performance targets.
For investors, the most useful reading of executive pay therefore lies beneath the headline number – in the detailed terms of the award, the conditions governing vesting and the eventual value delivered to shareholders.
Data and Verification Notes
- Company selection follows September 2026 market-capitalisation rankings.
- Remuneration figures were checked against corporate regulatory filings and annual reports. Samsung’s co-CEO disclosures were additionally cross-checked against Korean financial reporting.
- Nvidia’s latest published figures relate to its fiscal year ended January 25, 2026. The other completed compensation figures relate to fiscal 2025.
- Nvidia’s US$1.50 million base salary corresponds to US$1,497,627 in salary actually reported, while Alphabet’s US$2 million annual base corresponds to US$2,007,692 reported for 2025.
- For TSMC and Samsung, the salary amounts are the figures disclosed for the year.
- Share-return calculation: Percentage change in share price from the final trading close of 2024 to the final close of 2025, and from the final close of 2025 to September 18, 2026.
- Dividends are excluded.
- Alphabet uses GOOG (Class C), TSMC uses its US-listed TSM depositary receipts in US dollars, and Samsung uses its Korean-listed common shares, ticker 005930, in Korean won.
- South Korea’s final trading session in both 2024 and 2025 was December 30.
- These are company-stock returns, not returns earned personally by the CEOs.


What the World’s Top 10 Tech CEOs Really Earn

Executive Regulations Issued for Special Economic Zones & Free Zones Law in Oman

UAE Moves 6G ‘Golden Band’ Closer to Commercial Reality

Can You Earn 4.5% on Your Savings in Oman? The Truth About Money Market Funds

Top 5 Interesting Things AI Did This Month – September 2026 Edition

Casino Lookalikes Hide Gambling, Scams & Cybercrime: Infoblox Research

Yango Ride Introduces Group Accounts in Oman for Families & Businesses

Botswana Officials: HM The Sultan’s Visit to Botswana Carries Strategic Diplomatic, Economic Dimensions

The Economics of Khareef in Dhofar: What Is Two Months of Rain Worth in OMR?

OPINION: The Sultan Haitham City Residency Rule Most Buyers Don’t Know About

Power And Beyond: The Path To A Low-carbon Future

Al Mouj Muscat unveils Ghadeer Villas

Time to Buy Saudi Stocks? Some Investors Look at Dubai Instead

Hospitality Industry in Oman Estimated 90% Growth in 2022

Renewables are booming, but not fast enough to cap greenhouse emissions

Retail Abu Dhabi’s ‘Unbox Amazing’ generates sales of more than AED 2 billion in participating stores

Saudis Sign Deals From Energy to Metals in Bid to Salvage Forum

Saudi Arabia’s Gold Miner Plans to Be a Global Top-20 Supplier

Technology to drive Sultanate’s downstream industry

Digitization and Logistics Service Providers Can Help SMEs Make the Most of Peak Season Retail Trends

Amr Baabood: Oman Climate Week Is About Moving From Climate Ambition to Climate Action

Mayan Al Asfoor on Leadership, Legacy and Empowering Omani Talent

LEADERSPEAK: Dhofar Insurance CEO Sunil Kohli on Oman’s Insurance Sector, Reinsurance & Market Outlook

VIDEO: Robert MacLean on how NHI is Shaping Oman’s Next Generation of Hospitality Leaders

The Future of Oman: Decoding The Sultanate of Oman’s Strategic Promotional Nation Brand

EXCLUSIVE: AI, Robotics & Wearable Sensors are Changing the Lives of Dementia Patients

EXCLUSIVE: Talking Renewable Projects & Sustainability in Oman and Beyond with Vipul Tuli

VIDEO: Eng. Salim Al Thuhli, CEO, Khazaen Economic City on Investment Opportunities

H.E. Salim Al Aufi, Minister of Energy & Minerals talks about Oman’s Green Hydrogen Goals

VIDEO: Talking Latest Developments in Aircraft Ground Guidance & More at Oman Airports
-

 Highlights1 month ago
OERLive: Top 10 Mathematical Problems AI Has Solved or Transformed
-
 Magazines4 weeks ago
OER Magazine July Edition 2026
-

 Magazines4 weeks ago
Al Mar’a Magazine July 2026
-

 Banking & Finance2 months ago
Oman Housing Bank launches digital waiting list for housing loans
-

 Alamaliktistaad Magazines4 weeks ago
Alam Al-Iktisaad Magazine July 2026 Edition
-
 Banking & Finance1 month ago
Oman Arab Bank CEO Sulaiman Al Harthi Retires as Ali Al Mani Is Named Successor
-
 Artificial Intelligence4 days ago
Top 5 Interesting Things AI Did This Month – September 2026 Edition
-
 Magazines1 month ago
OER Magazine – June 2026 Edition