Entertainment
The Hidden Price of Convenience: What People in Oman Spend on Food Delivery, Coffee & Subscriptions

A morning coffee, dinner delivered after work and a handful of digital subscriptions can quietly add up to hundreds of rials a year. For residents in Oman, understanding that accumulated bill can reveal opportunities to save without giving up the conveniences they value.
When residents review their monthly expenses, rent, school fees and loan repayments are usually easy to identify, while the smaller purchases scattered across bank statements attract considerably less attention. A coffee collected on the way to work, a meal ordered after a demanding day and a streaming subscription renewed automatically may each appear affordable, yet their combined cost can help explain why there is less money left at the end of the month than expected.
The challenge is that convenience is purchased one transaction at a time but paid for across an entire year. Someone buying 22 coffees a month at OMR 2 each, placing 12 food orders with a checkout total of OMR 5 each and maintaining OMR 15 in subscriptions would spend OMR 119 a month, or OMR 1,428 annually, on those three categories alone.
This is an illustrative budget rather than a measured average for Oman, and the entire amount should not be mistaken for potential savings because meals and drinks would still need to be replaced. Nevertheless, it demonstrates how familiar routines can create a substantial financial commitment without any individual purchase feeling particularly expensive.
Understanding how much residents actually spend requires a distinction between research findings, advertised prices and hypothetical household budgets. The available sources reviewed for this article do not establish a nationally representative average covering delivery, café coffee and digital subscriptions together, although local research offers a useful indication of food-delivery expenditure among a specific group of consumers.
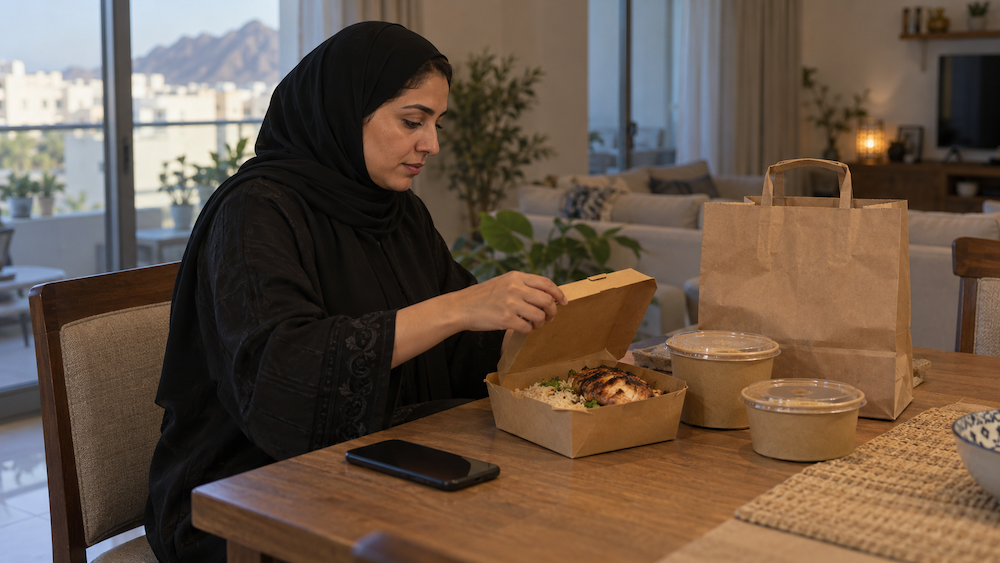

A study published in Preventive Medicine Reports in 2025 surveyed 467 Omani adults attending six primary healthcare centres in Al Seeb and Bausher between January and June 2023. Among the 359 respondents who used online food delivery services, average expenditure was OMR 11.14 per week, with orders placed an average of 2.13 times weekly. At an unchanged spending rate, that translates to approximately OMR 48.27 a month, or OMR 579 a year.
There was considerable variation between respondents, with the reported weekly spending standard deviation of OMR 12.84 exceeding the average itself. The findings also relate to Omani healthcare-centre attendees in two Muscat areas, exclude non-Omanis and reflect behaviour recorded in 2023, meaning they should not be presented as a current national average.
Furthermore, the expenditure includes food purchases rather than isolating the delivery charges attached to them.
What makes delivery spending particularly easy to underestimate is the difference between the price that first attracts a customer and the total eventually paid. Depending on the order, the final amount can include delivery or service charges as well as drinks, desserts and other additions selected along the way.
A leading food delivery brand’s information states that delivery fees vary according to restaurant and location, while its Oman terms explain that subscription-based delivery benefits depend on eligible orders, participating merchants and minimum order values.
For a hypothetical meal priced at OMR 3.500, adding OMR 0.700 in applicable fees and an OMR 0.800 drink brings the checkout total to OMR 5. Repeated 12 times a month, the fees and drink together account for OMR 18 monthly, or OMR 216 annually, over and above the meal price. Neither expense is necessarily unreasonable, but their significance becomes clearer when they are viewed as a recurring commitment.
Minimum-spend promotions can introduce a similar trade-off, particularly when customers add something they did not intend to buy to qualify for a benefit. Spending OMR 1.500 on an unwanted item to avoid a 700-baisa delivery charge increases the final bill by 800 baisa, although the calculation may be more favourable if the extra item replaces a planned purchase. The useful comparison is therefore between the total cost of the original basket and the total cost after applying the offer.
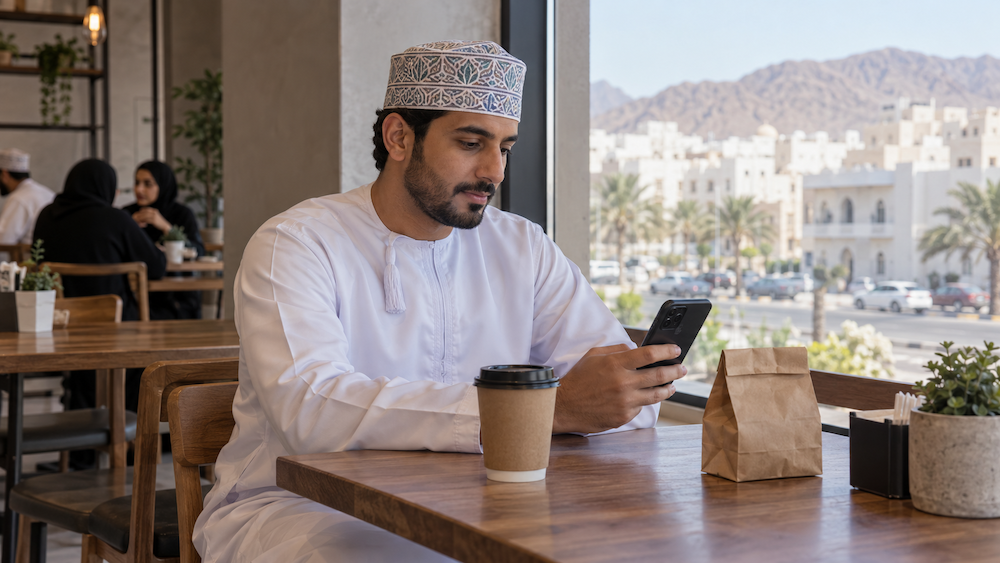
Café spending follows much the same pattern, with frequency often having a greater effect on the monthly bill than a modest difference between menu prices. Numbeo’s crowdsourced Muscat listing, updated on October 13, 2026, reported a regular cappuccino price of OMR 1.950, within a listed range of OMR 1.500 to 3.000. While this provides an indicative price benchmark, it does not establish how often residents visit cafés or how much they spend on coffee overall.
Using a rounded price of OMR 2 per cup shows how different routines affect the annual total:
| Café coffee routine | Monthly spending | Annual spending |
|---|---|---|
| Eight coffees a month | OMR 16 | OMR 192 |
| One coffee on each of 22 working days | OMR 44 | OMR 528 |
| Thirty coffees a month | OMR 60 | OMR 720 |
These calculations exclude pastries, additional shots and delivery charges, while assuming the same price and purchasing frequency throughout the year. A customer who regularly adds a snack would spend more, whereas someone choosing a lower-priced drink or buying coffee less frequently would spend less.
However, treating every café purchase as an avoidable expense overlooks what customers may receive beyond the drink itself. A café can provide somewhere to meet friends, hold an informal business discussion or spend a quiet hour away from work and home, making the value of a visit difficult to judge solely against the cost of brewing coffee in a kitchen.
For someone trying to reduce expenditure, distinguishing those valued occasions from purchases made automatically may produce a more sustainable result than giving up cafés altogether.
Subscriptions are less visible because their cost can continue without a fresh purchasing decision, allowing an account to remain active long after the initial enthusiasm has faded. Spotify’s Oman page, for example, listed Premium Individual at US$5.49 a month after its introductory offer when checked for this article, equivalent to approximately OMR 2.11 at the rial’s official dollar peg, before any applicable card charges.

A single service used regularly may represent excellent value, but music, video streaming, cloud storage, paid applications and delivery memberships can collectively create a larger bill than their individual prices suggest. An illustrative subscription budget of OMR 15 a month amounts to OMR 180 a year, while OMR 25 a month becomes OMR 300, even before considering whether every service is still being used.
Cost per use provides a more meaningful way to assess these payments. A hypothetical OMR 4 subscription used on 20 evenings costs 200 baisa per evening, whereas the same subscription used only once costs OMR 4 for that occasion. Similarly, an annual plan may offer good value to a consistent user but prove more expensive than paying for selected months if interest in the service fades.
When delivery, coffee and subscriptions are considered together, the difference between occasional and frequent use becomes substantial:
| Illustrative monthly routine | Occasional use | Regular use | Frequent use |
|---|---|---|---|
| Coffee at OMR 2 each | 8 cups: OMR 16 | 22 cups: OMR 44 | 30 cups: OMR 60 |
| Delivery at OMR 5 per order, including fees | 4 orders: OMR 20 | 12 orders: OMR 60 | 20 orders: OMR 100 |
| Assumed subscription budget | OMR 8 | OMR 15 | OMR 25 |
| Monthly total | OMR 44 | OMR 119 | OMR 185 |
| Annual total | OMR 528 | OMR 1,428 | OMR 2,220 |
These scenarios illustrate the arithmetic of different habits rather than estimating how many residents fall into each category. Café drinks are counted separately from food deliveries to avoid duplication, and any delivery membership is included within the assumed subscription budget.
The effect on disposable income also depends on earnings and existing commitments. For someone earning an illustrative OMR 800 a month, the OMR 119 routine would absorb almost 15 per cent of income, compared with just under 10 per cent for someone earning OMR 1,200. Neither salary is presented as an average, but the comparison shows why the same spending pattern may feel comfortable in one household and restrictive in another.
Calculating realistic savings requires allowing for the cost of alternatives, rather than assuming that every cancelled order or skipped coffee leaves its full purchase price available to save. In the regular-use example, replacing 14 of the 22 café coffees with home-made drinks costing an assumed 400 baisa each would reduce the monthly coffee bill from OMR 44 to OMR 21.600, while preserving eight café purchases.
Replacing six of the 12 delivered meals with home-prepared alternatives costing an assumed OMR 1.500 each would bring spending on those meals down from OMR 60 to OMR 39. If the same person also removed OMR 11 in unused or overlapping subscriptions, retaining OMR 4 of services they valued, the combined reduction would be OMR 54.400 a month.
| Change | Estimated monthly saving | Estimated annual saving |
|---|---|---|
| Replace 14 café coffees with home-made drinks | OMR 22.400 | OMR 268.800 |
| Replace six deliveries with home-prepared meals | OMR 21.000 | OMR 252.000 |
| Remove OMR 11 in subscriptions | OMR 11.000 | OMR 132.000 |
| Total | OMR 54.400 | OMR 652.800 |
At approximately OMR 653 annually, the saving is meaningful, but it depends on the stated assumptions. Replacement meals must provide equivalent portions, so an order feeding several people cannot reasonably be replaced using the same allowance as a meal for one. The home-preparation figures also allow for assumed ingredients and basic running costs while excluding new equipment and the value of the person’s time.
Those qualifications matter because convenience can be economically and practically worthwhile. A parent balancing employment and childcare, someone with limited mobility or an employee returning from a late shift may reasonably decide that paying for delivery is preferable to shopping, preparing a meal and cleaning up afterwards.

For a person living alone, buying ingredients in quantities that cannot be fully used may also reduce the expected savings from cooking.
The same reasoning applies to subscriptions and café visits, especially when they replace something more expensive or support work and daily life. A streaming service may provide a household with affordable entertainment, cloud storage may protect important files, and a paid application may save hours of work. Removing these services indiscriminately could reduce value without making a meaningful improvement to the household budget.
The most useful review therefore begins with actual behaviour: what was purchased, how often it was used and whether it still justified its place in the budget. A month of bank and card transactions, checked against delivery-app histories and subscription records, can reveal patterns that are difficult to notice when purchases are considered individually.
Annual subscriptions should also be divided by 12 so their monthly equivalent is included.
Rather than setting an ambitious target that becomes difficult to maintain, residents could begin by preserving their favourite purchases, choosing a manageable delivery allowance and cancelling services that have fallen out of use. Transferring the resulting saving into a separate account can help ensure that the money remains available for a defined purpose instead of being absorbed by another spending category.
None of this suggests that coffee or takeaway meals explain every household’s difficulty in saving, particularly when rent, school fees, debt repayments and limited income can exert far greater pressure. Small pleasures have a legitimate place in a budget, and reviewing them should be an exercise in making informed choices rather than assigning blame.
The financial risk emerges when spending continues without a clear understanding of its cumulative cost, allowing an occasional convenience to become an unexamined commitment. An OMR 2 coffee may be worth every baisa, just as a delivered dinner may be the most practical choice on a demanding evening; knowing what those decisions add up to over a year allows residents to enjoy them with greater control over the money they have left.
Methodology: Prices were checked on October 15, 2026. The delivery study’s weekly expenditure was converted using 52 weeks divided by 12 months. All other spending profiles and savings calculations are illustrative editorial calculations, not survey findings. Annual projections assume unchanged prices and habits; no investment returns are included.
*All images in this article were generated by AI models. Resemblance with anyone living or otherwise is unintended.