Banking & Finance
OERLive ANALYSIS: Which Companies in Oman Have Paid Investors the Most Dividends?

A five-year review of Muscat-listed companies puts Bank Muscat at the top by total cash distributed, while energy listings, special payouts and smaller industrial businesses reveal a much broader dividend story.
For investors trying to establish which companies in Oman have put the most cash into shareholders’ hands, the five completed calendar years from 2021 to 2025 point first to Bank Muscat, whose ordinary cash dividends totalled approximately OMR541.3 million.
Yet a market-wide review also brings forward names that can disappear from a familiar shortlist of banks and telecom operators, including Oman Cement, National Biscuit Industries, Sahara Hospitality and several electricity and desalination companies.
Across the same period, newly listed energy businesses accumulated substantial distributions in remarkably short public-market histories, with OQ Exploration & Production reaching approximately OMR332.6 million after its October 2024 listing. That places it ahead of Omantel, whose cash distributions totalled approximately OMR210 million across the five-year period, including an additional interim payment in August 2023.
Although these figures underline the scale of shareholder distributions across Oman’s capital market, the comparison measures the total cash distributed by each company rather than the returns earned on equivalent investments in their shares.
How the Comparison Was Built


To capture substantial payers beyond the market’s most recognisable names, our review screened the MSX company directory and dividend register against the exchange’s annual bulletins for 2021 to 2025, then reconciled leading distributions with issuer financial statements and corporate announcements.
The coverage includes banking, telecoms, energy, utilities, manufacturing, consumer businesses, insurance, investment companies, hospitality and other services; historical names and recent listings were checked as well.
For a consistent five-year boundary across companies with different financial year ends, dividends are assigned to the calendar year of shareholder entitlement, with payment disclosures used as a cross-check, rather than automatically to the financial year whose profits funded them.
A dividend for financial year 2025 paid in 2026 therefore belongs outside the principal comparison, while payments made before a company’s public listing are excluded from its public-investor record.
Because cash dividends, bonus shares and returns of capital are materially different transactions, the ranking counts ordinary-share cash distributions and excludes bonus shares, distributed bonds, bond coupons, buybacks and liquidation capital repayments.
Figures cover eligible ordinary shareholders, including strategic and government investors; they do not represent cash received by retail investors alone, and funds, REIT units, preference shares and private companies sit outside this company ranking.
For the purposes of this ranking, aggregate distributions are calculated using the gross ordinary-share cash dividend declared by each company and the applicable share base at the time of entitlement.
This approach includes dividends attributable to shares held by corporate groups or subsidiaries where they form part of the issuer’s gross declared distribution, rather than applying individual consolidation adjustments to selected companies.
Consequently, the figures represent company-level cash dividends declared to eligible shareholders and should not be interpreted as the net amount of cash ultimately leaving each consolidated corporate group.
The Companies That Distributed the Largest Cash Amounts
When the individual distributions are added using the share base applicable to each payment, the leading companies identified in the screen form a diverse list that includes four recent energy and industrial listings, a shipping company and an established cement producer.
Amounts below are rounded to the nearest OMR0.1 million, with shorter post-listing histories identified explicitly.
For any discrepancies or corrections, please contact: alvin@umsoman.com
| Rank | Company | Cash dividends (OMR million) | Period |
|---|---|---|---|
| 1 | Bank Muscat | 541.3 | 2021 to 2025 |
| 2 | OQ Exploration & Production | 332.6 | Post-listing 2024 to 2025 |
| 3 | Omantel | 210.0 | 2021 to 2025 |
| 4 | Sohar International | 115.6 | 2021 to 2025 |
| 5 | OQ Gas Networks | 114.5 | 2024 to 2025 |
| 6 | Oman Cement | 79.7 | 2021 to 2025, including specials |
| 7 | Ominvest | 77.0 | 2021 to 2025, gross cash dividends |
| 8 | Bank Dhofar | 75.8 | 2021 to 2025 |
| 9 | Ahlibank | 64.2 | 2021 to 2025 |
| 10 | Ooredoo Oman | 58.1 | 2021 to 2025 |
| 11 | Asyad Shipping | 51.3 | Post-listing 2025 |
| 12 | OQ Base Industries | 50.0 | 2025 |
| 13 | Abraj Energy Services | 49.0 | Post-listing 2023 to 2025 |
| 14 | National Bank of Oman | 47.2 | 2021 to 2025 |
| 15 | Sembcorp Salalah | 36.4 | 2021 to 2025 |
Sources: MSX dividend and capital records; issuer annual reports and financial disclosures listed in the source notes. These figures represent calculated gross cash distribution totals rather than an exchange-published ranking. Ominvest’s approximately OMR77 million includes its gross 2021 parent-company distribution, of which around OMR3.485 million was attributable to group-held treasury shares and eliminated on consolidation. Excluding that component would reduce its adjusted five-year total to approximately OMR73.5 million. Phoenix Power follows the companies shown above at approximately OMR35.2 million over 2021 to 2025, while its substantially larger special dividend approved in October 2026 is discussed separately.
Banks Lead by Scale, but Share Changes Matter


With annual cash distributions rising from approximately OMR81.2 million in 2021 to OMR123.9 million in 2025, Bank Muscat combines the largest cumulative payout in this comparison with a growing company-wide cash distribution. Its five annual amounts were approximately OMR81.2 million, OMR107.2 million, OMR112.6 million, OMR116.3 million and OMR123.9 million, respectively.
For a shareholder reading only the dividend-per-share column, however, Bank Muscat’s movement from 30 baiza in 2022 to 15 baiza in 2023 can create a misleading impression unless the bank’s substantial bonus-share issues are taken into account.
A one-for-one bonus issue in November 2022 doubled the share count, following an earlier 5% bonus that year; the subsequent 15-baiza cash payment was therefore spread over a much larger number of shares.
| Bank | 2021 | 2022 | 2023 | 2024 | 2025 |
|---|---|---|---|---|---|
| Bank Muscat | 25 | 30 | 15 | 15.5 | 16.5 |
| Sohar International | 0 | 4 | 4.5 | 5.5 | 8 |
| Bank Dhofar | 4 | 2 | 5 | 7.75 | 6.55 |
| Ahlibank | 5 | 7.5 | 9 | 4.5 | 5 |
| National Bank of Oman | 0 | 3.7 | 7.4 | 8.5 | 9.4 |
| Bank Nizwa | 1.25 | 3.442 | 4.038 | 2.3 | 2.45 |
| Oman Arab Bank | 0 | 0 | 0 | 0 | 0 |
Cash dividend per share in baiza, by calendar entitlement year; 1,000 baiza equal OMR1. Figures are the rates announced at the time, without retrospective adjustment for bonus shares or other capital changes. Zero denotes no ordinary cash dividend identified for that calendar year in the reviewed records.
Oman Arab Bank’s zero entries refer specifically to ordinary-share cash dividends within the 2021 to 2025 calendar window, which excludes its 2024 distribution of six baiza per share through mandatory convertible bonds. The bank subsequently approved a five-baiza cash dividend per share, totalling approximately OMR10 million, on 30 March 2026 for financial year 2025; this falls outside the period covered by the table.
As the banking table demonstrates, a broader definition of “dividend” can also exaggerate the cash element of a distribution when an announcement combines money with securities.
Ahlibank’s 2025 distribution included five baiza in cash and five baiza in mandatory convertible bonds, while its 2024 distribution combined 4.5 baiza of each; only the cash portions enter this comparison.
Telecoms Offer Two Different Five-Year Records
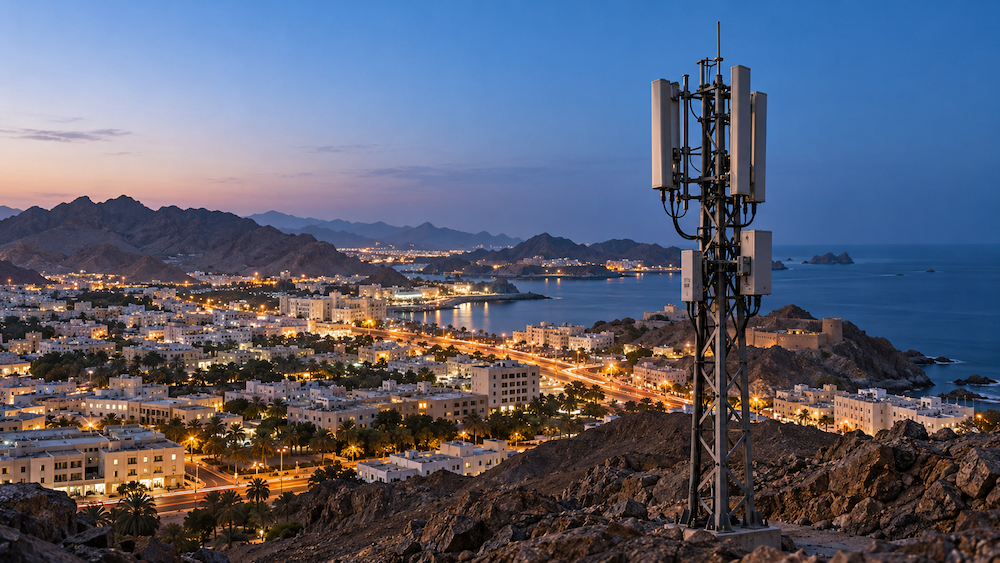

Across five consecutive calendar years, Omantel maintained a regular annual cash distribution of 55 baiza per share, supplemented by an additional interim dividend of five baiza per share paid in August 2023.
As a result, shareholders received 60 baiza per share in 2023, compared with 55 baiza in each of the other four years. The five-year cumulative distribution therefore reached 280 baiza per share, equivalent to approximately OMR210 million across the company’s 750 million ordinary shares.
For an investor who held 10,000 Omantel shares throughout the relevant entitlement dates, these distributions would have generated OMR2,800 in gross cash dividends over the period, before any investor-specific costs or taxes. The figures demonstrate the consistency of Omantel’s regular dividend policy while also capturing the additional shareholder return provided by its 2023 interim payment.
Energy Listings Have Changed the Dividend Landscape
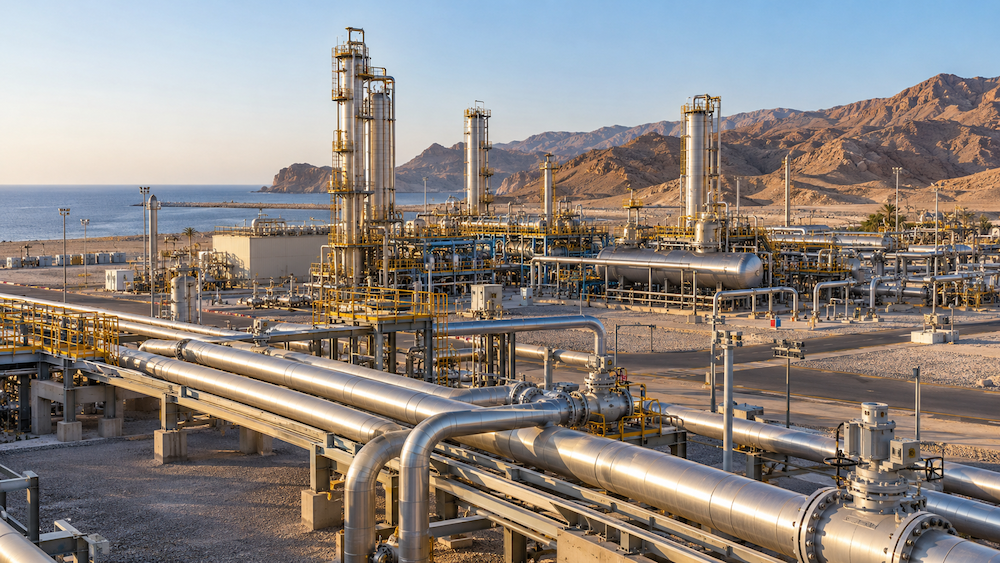
Although their public-market records are shorter than those of the established banks and telecom operators, OQ Exploration & Production, OQ Gas Networks, OQ Base Industries and Abraj Energy Services have already become substantial sources of shareholder cash.
OQEP’s approximately OMR332.6 million comprises its OMR57.675 million post-listing distribution in 2024 and OMR274.878 million in 2025; earlier payments to its pre-IPO owner are excluded.
For OQ Gas Networks, the calendar-year approach produces approximately OMR114.5 million across distributions in 2024 and 2025, including payments in 2024 that related to the company’s 2023 earnings. OQ Base Industries, which listed in December 2024, distributed approximately OMR50.0 million in 2025, while Abraj’s 20, 21.2 and 22.47 baiza per share in 2023, 2024 and 2025 amount to approximately OMR49.0 million across its post-listing record.
The same distinction between public and pre-IPO shareholders matters for Asyad Shipping, whose reported OMR61.2 million of dividends in 2025 included approximately OMR9.9 million distributed before listing. The two post-listing payments, approximately OMR22.3 million and OMR29.0 million, produce the OMR51.3 million included in the ranking.
Smaller Companies Deserve a Place in the Dividend Discussion

Beyond the largest cash pools, the per-share records of Oman’s industrial, consumer and service companies reveal substantial distributions that deserve to be included in any serious review of the market.
National Biscuit Industries paid 150, 250, 250, 250 and 500 baiza per share during 2021–2025, equivalent to OMR1.40 cumulatively on an unchanged share count, while Sahara Hospitality’s announced cash rates rose from 120 baiza in 2021 to 250 baiza in each of 2023, 2024 and 2025.
| Company | 2021 | 2022 | 2023 | 2024 | 2025 |
|---|---|---|---|---|---|
| National Biscuit Industries | 150 | 250 | 250 | 250 | 500 |
| Sahara Hospitality | 120 | 150 | 250 | 250 | 250 |
| Oman Chromite | 0 | 0 | 200 | 100 | 200 |
| Al Maha Petroleum | 0 | 40 | 85 | 90 | 85 |
| Oman Cables Industry | 13 | 27 | 56 | 85 | 91.5 |
| Oman Cement | 10 | 10 | 10 | 120.89 | 90 |
| Oman Education & Training Investments | 25 | 20 | 30 | 60 | 100 |
| Oman Refreshment | 50 | 60 | 60 | 40 | 0 |
| Hotels Management Company International | 0 | 0 | 200 | 0 | 0 |
| Gulf Hotels Oman | 0 | 0 | 0 | 100 | 100 |
| Oman Oil Marketing | 0 | 40 | 50 | 32 | 50 |
| Shell Oman Marketing | 0 | 36 | 57 | 36 | 37 |
| Oman United Insurance | 35 | 35 | 35 | 30 | 25 |
| Oman Flour Mills | 60 | 33 | 12.5 | 11.08 | 25 |
| Al Jazeera Steel Products | 26 | 32 | 15 | 19 | 43 |
| National Detergent | 50 | 0 | 0 | 25 | 50 |
| Renaissance Services | 20 | 20 | 20 | 30 | 30 |
| Al Maha Ceramics | 23 | 50 | 20 | 15 | 0 |
| Oman Chlorine | 12.5 | 17.5 | 25 | 20 | 17.5 |
| Al Jazeera Services | 45 | 11 | 10 | 0 | 15 |
| Salalah Mills | 20 | 20 | 20 | 0 | 20 |
| Oman Packaging | 25 | 20 | 10 | 12 | 10 |
| Al Anwar Ceramic Tiles | 13.5 | 25 | 10 | 20 | 4 |
| Dhofar Insurance | 10 | 15 | 15 | 15 | 15 |
| Salalah Port Services | 25 | 10 | 10 | 10 | 10 |
| Voltamp Energy | 5 | 3 | 0 | 8 | 35 |
Announced ordinary cash dividends in baiza per share, by calendar entitlement year; bonus shares are excluded. These nominal per-share figures are not a ranking of investment returns: share prices, denominations and capital changes differ. Companies with bonus-share changes during the window include Sahara Hospitality, Oman Chromite, Oman Flour Mills, National Detergent, Oman Chlorine and Voltamp Energy.
Among the industrial businesses with a rising annual cash rate throughout the period, Oman Cables stands out for increasing its dividend from 13 baiza in 2021 to 91.5 baiza in 2025, with intermediate payments of 27, 56 and 85 baiza.
Its cumulative 272.5 baiza per share corresponds to approximately OMR24.4 million company-wide, illustrating how a smaller issuer can have a substantial per-share record while remaining below the aggregate-payment leaders.
For Oman Cement, the explanation behind its high position in the cash ranking is more concentrated, because the OMR40.0 million distributed in 2024 and OMR29.8 million distributed in 2025 included unusually large payments from retained earnings.
The 120.89-baiza distribution in 2024 combined a 25-baiza ordinary component with a 95.89-baiza special component, while the 90-baiza payment in 2025 comprised 25 baiza plus an additional 65 baiza from earlier retained earnings; treating those totals as an automatically recurring annual dividend would misread the record.
Power and Water Companies Require a Closer Reading
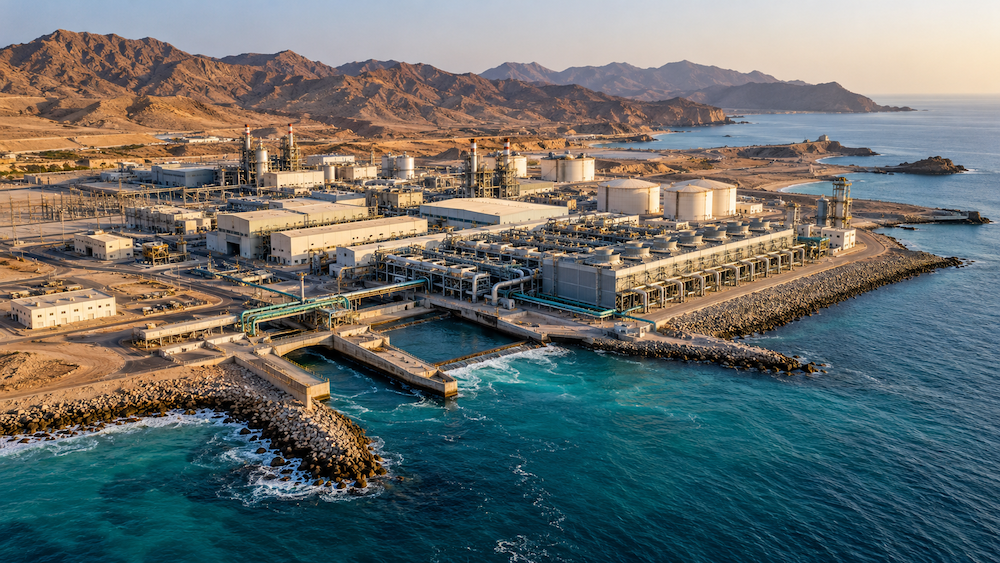
Within the electricity and desalination sector, differences in project size, financing arrangements and the timing of distributions produce records that are more varied than a single “utility dividend” label suggests.
Sembcorp Salalah and Phoenix Power distributed approximately OMR36.4 million and OMR35.2 million respectively over 2021 to 2025, while Musandam Power maintained substantial nominal per-share distributions and Sharqiyah Desalination settled at 15 baiza annually from 2023.
| Company | 2021 | 2022 | 2023 | 2024 | 2025 |
|---|---|---|---|---|---|
| Musandam Power | 27.6 | 29.8 | 27.6 | 27.6 | 27.6 |
| Sharqiyah Desalination | 13.77 | 14.99 | 15 | 15 | 15 |
| Barka Desalination | Not listed | 12 | 12 | 12 | 12 |
| Muscat City Desalination | 9.644 | 18.965 | 6.42 | 4.822 | 5.143 |
| Sembcorp Salalah | 6.1 | 6 | 7.5 | 10.5 | 8 |
| Phoenix Power | 3.9 | 4.15 | 5.25 | 5.25 | 5.5 |
| Al Suwadi Power | 6.5 | 7.5 | 0 | 13 | 7 |
| Al Batinah Power | 6 | 7 | 0 | 11.5 | 7.6 |
| SMN Power Holding | 0 | 0 | 15 | 0 | 73 |
| Barka Water and Power | 0 | 0 | 0 | 32.18 | 36.93 |
Cash dividends in baiza per share by calendar entitlement year; multiple distributions within a year are combined. Special cash dividends are included, while liquidation capital repayments are excluded.
The unusually high 73-baiza payment recorded for SMN Power in 2025 needs particular context, because it followed years with no cash dividend and arose alongside the company’s refinancing and renewed operating agreements.
Its 2024 annual report described the proposed distribution of up to approximately OMR14.58 million, underlining why a single large payment should be considered alongside the surrounding years and the financing events that made it possible.
Major 2026 Developments Belong Beside the Five-Year Ranking
Although the main table ends in December 2025, several developments during 2026 are too substantial to omit from this article (dated 29 October 2026), particularly Phoenix Power’s approval of an 81-baiza distribution at its 7 October ordinary general meeting.
At the company’s issued share count, that represents approximately OMR118.5 million, more than three times its entire cash distribution in the five-year comparison, and follows a refinancing completed in June 2026.
Among other developments outside the historical window, OMIFCO’s July 2026 listing introduced a major fertiliser producer whose September entitlement was 6.763 baiza per share, while National Real Estate Development & Investments announced a 774-baiza dividend payable in April 2026.
Both deserve attention in a current market review, but neither should be inserted into a 2021–2025 public-investor ranking or presented as evidence of five years of listed-company distributions.
For established names already covered in the historical tables, the subsequent record also contains substantial payments, including Bank Muscat’s OMR135.1 million cash dividend approved in March 2026 and National Biscuit Industries’ 600-baiza distribution that year.
What the Dividend Record Actually Tells Investors
For a reader comparing the cash return on money invested, the distinction between a dividend percentage and a dividend yield remains essential, because a percentage of nominal share capital says nothing by itself about the price paid for the shares.
A 20-baiza dividend on a share with a 100-baiza nominal value may be described as a 20% cash dividend, but its yield is 10% at a purchase price of 200 baiza and 5% at 400 baiza.
When the full five-year record is considered alongside that distinction, Oman’s dividend market emerges as a combination of large cash distributors, established repeat payers, newer public companies and businesses that occasionally release substantial accumulated earnings.
Bank Muscat leads this comparison by aggregate cash distributions, while Omantel demonstrates the consistency of established telecom dividend payments through five consecutive annual distributions of 55 baiza per share, supplemented by an additional interim payment in 2023.
Oman Cables illustrates how industrial businesses can deliver substantial growth in their annual dividend rates, while companies such as National Biscuit, Sahara Hospitality, Oman Cement and the power producers demonstrate that the dividend landscape extends well beyond the market’s most familiar large-cap names. Taken together, these records reveal a market in which shareholder distributions are influenced not only by corporate size and profitability but also by capital structures, retained earnings, financing arrangements and the timing of individual payments.
Research cutoff: 29 October 2026. Historical comparison: calendar entitlement years 2021 to 2025. Calculations are rounded; past distributions do not establish future payments.
Sources & Calculation Data used for Research
- Muscat Stock Exchange dividend register and annual bulletins. Calendar entitlement dates, cash rates, share capital and corporate actions were checked against the MSX dividend register and the exchange’s annual bulletins for 2021, 2022, 2023, 2024 and 2025. The 2025 bulletin’s dividend tables appear on printed pages 29–30.
- MSX issuer universe. The MSX company directory returned 114 current listed securities, comprising 104 company share lines after excluding six fund lines and four preference-share lines. Historical directory and dividend records were also screened. This is a listed-market comparison, rather than a census of privately held Omani companies.
- Bank Muscat dividend history and financial statements. The five-year aggregate uses cash distributions of OMR81.238 million, OMR107.234 million, OMR112.596 million, OMR116.349 million and OMR123.856 million. Sources: dividend distribution policy and history, 2021 annual report, September 2022 financial statements and 2024 audited statements.
- OQ Exploration & Production post-listing cash distributions. The 12 November 2024 announcement specifies OMR57.675 million for the first post-listing distribution. The 2025 audited filing reports OMR274.878 million paid in 2025; the 2025 annual report rounds this to OMR275 million. Combined: OMR332.553 million, displayed as OMR332.6 million.
-
Omantel cash dividend record. Omantel distributed regular cash dividends of 55 baiza per share in each calendar year from 2021 to 2025, together with an additional interim dividend of five baiza per share paid in August 2023. The five-year cumulative distribution was therefore 280 baiza per share, equivalent to approximately OMR210 million across the company’s 750 million ordinary shares. The 2023 total is 60 baiza per share, reflecting the ordinary annual distribution and additional interim payment. Sources: Omantel’s 2023 interim financial statements, Q3 2023 investor presentation, 2022 annual report and 2025 financial statements. Dividends distributed by subsidiary Zain are not counted as Omantel ordinary-share dividends.
- Sohar International share capital and dividends. The calculation uses the actual share count applicable to each distribution. Cash dividends in 2022–2025 were approximately OMR11.960 million, OMR20.655 million, OMR30.073 million and OMR52.938 million; no ordinary cash dividend was identified for 2021. Sources: share capital history, 2024 financial statements and 2022 financial statements.
- OQ Gas Networks distributions. Calendar 2024 combines 7.62, 2.54 and 5.75 baiza; calendar 2025 combines 4.92 and 5.60 baiza. Sources: 2024 annual report and 2025 audited notes.
- Bank Dhofar dividend history. Calendar cash rates total 25.3 baiza over 2021–2025. The relevant pre-bonus share base was 2,996,351,440 shares, producing approximately OMR75.8 million. Sources: official dividend history, 2023 third-quarter financial statements and 2025 audited filing.
-
Ominvest cash distributions and treasury-share adjustment. Calendar cash dividend rates for 2021–2025 were 25, 30, 15, 20 and 20 baiza per share, respectively. The gross parent-company cash dividends over the five-year period totalled approximately OMR77 million. Ominvest’s 2021 parent-company financial statements recorded a cash dividend of OMR20.194 million, while its consolidated financial statements reflected a treasury-share dividend adjustment of approximately OMR3.485 million. The ranking adopts the gross declared cash distribution methodology, consistent with the treatment of other companies, and therefore retains the OMR77 million total. Excluding the 2021 treasury-share adjustment would produce an alternative group-adjusted figure of approximately OMR73.5 million. Non-cash distributions, including bonus shares, perpetual bonds and mandatory convertible instruments, are excluded. Sources: Ominvest’s 2021 audited and interim financial statements, 2022 audited financial statements, 2022 AGM disclosure and September 2025 investor presentation.
- Ahlibank cash and convertible-bond components. Calculations use 1,949,657,466 shares for 2021–2023 and 2,349,657,466 for 2024–2025. Matching mandatory convertible bond components in 2024 and 2025 are excluded. Sources: 2021 cash dividend approval, 2021 audited filing, 2025 audited statements and issuer market disclosures.
- Ooredoo Oman distributions. Cash rates of 25, 18, 20, 14.7 and 11.53 baiza on 650,944,230 shares produce approximately OMR58.1 million. Sources: 2022 financial report and 2025 audited financial statements, including note 19.
- Asyad Shipping and OQ Base Industries. Asyad’s two post-listing distributions total approximately OMR51.3 million; its OMR9.9 million pre-IPO payment is excluded. OQBI’s 2025 calendar rates of 7.08, 2.37 and 5 baiza on 3,459,490,850 shares produce approximately OMR50 million. Sources: Asyad IPO booklet, Asyad 2025 audited filing, OQBI fourth-quarter 2024 distribution disclosure and OQBI first-half 2025 dividend announcement.
- Abraj Energy Services dividends. Calendar rates of 20, 21.2 and 22.47 baiza on 770.2 million shares produce approximately OMR49.0 million. Sources: issuer dividend information, 2024 annual report and MSX issuer record.
- National Bank of Oman dividend and capital records. A combined 29 baiza in 2022–2025 on 1,625,946,360 shares produces approximately OMR47.2 million; no ordinary cash dividend was identified for calendar 2021. Sources: 2022 AGM approval, MSX issuer record and the annual bulletins in source 1.
- Sembcorp Salalah and Phoenix Power. Sembcorp’s cumulative 38.1 baiza on 954,571,950 shares produces approximately OMR36.4 million. Phoenix’s cumulative 24.05 baiza on 1,462,601,460 shares produces approximately OMR35.2 million. Sources: Sembcorp 2024 annual report, Sembcorp MSX record, Phoenix MSX record and the annual bulletins in source 1.
- Bank Muscat’s 2022 non-cash corporate actions. The 5% bonus was followed by a one-for-one bonus in November 2022. Perpetual bonds distributed that November are excluded from cash dividends. Sources: Bank Muscat dividend history, September 2022 financial statements and Ominvest’s 2022 audited filing, which documents receipt of the bond distribution.
- National Biscuit Industries and Sahara Hospitality. National Biscuit has one million shares with OMR1 par value; its cumulative OMR1.40 per share implies OMR1.4 million in company-wide cash distributions. Sahara’s bonus issues mean its unadjusted annual rates should not be summed as the return on one unchanged shareholding. Sources: National Biscuit MSX profile, investor relations, 2025 audited filing and Sahara investor desk.
- Oman Cables and the broader industrial and service-company table. Oman Cables’ dividend history confirms rates of 13, 27, 56, 85 and 91.5 baiza. Other table rows are drawn from the MSX dividend register and annual bulletins in source 1. Oman Education’s 100-baiza 2025 entry is confirmed in the 2025 bulletin.
- Oman Cement ordinary and special dividends. Note 32 of the 2025 audited filing confirms OMR40 million paid in April 2024 and OMR29,778,544 paid in March 2025. The 20 February 2025 issuer announcement separates 25 baiza from current-year earnings and 65 baiza from earlier retained earnings. The 2024 special component is also explained in U Capital’s event analysis.
- SMN Power’s distribution and refinancing. The 2024 annual report describes refinancing, renewed project agreements and the proposed distribution of up to 73 baiza per share in 2025. The MSX issuer record records the 73-baiza entitlement on 26 March 2025. An undated estimated 25-baiza entry is not counted as a second 2025 payment.
- Phoenix Power’s 2026 special distribution. The 7 October 2026 OGM resolutions approved 81 baiza per share and cancelled the earlier six-baiza authorisation. The company also disclosed completion of refinancing on 29 June 2026. The article describes approval and does not assert a verified payment settlement date.
- OMIFCO’s public-market history. Sources: IPO booklet, Financial Services Authority IPO approval and MSX issuer record. MSX records a 6.763-baiza entitlement on 30 September 2026; pre-IPO distributions are excluded from the five-year ranking.
- National Real Estate Development & Investments’ 2026 announcement. S&P Capital IQ, via MarketScreener, reported the 774-baiza dividend announcement with a stated payment date of 30 April 2026. This is identified as an announcement; the historical MSX dividend line was not used to independently certify settlement.
- Bank Muscat’s 2026 AGM distribution. The issuer’s AGM disclosure via Bahrain Bourse records approval on 17 March 2026 of 18 baiza per ordinary share, approximately OMR135.115 million, outside the five-year comparison.
-
Bank Nizwa’s 2022 cash dividend. Bank Nizwa’s 2022 annual report, page 21, confirms that the bank paid a cash dividend of 3.442 baiza per share during the calendar year, following shareholder approval at the Annual General Meeting held on 28 March 2022. This replaces the rounded 3.5-baiza figure in the banking comparison. Source: Bank Nizwa Annual Report 2022, available at https://banknizwa-media.s3.me-central-1.amazonaws.com/cms%2Fannual_report_2022_en_4fe03f24bf.pdf.